

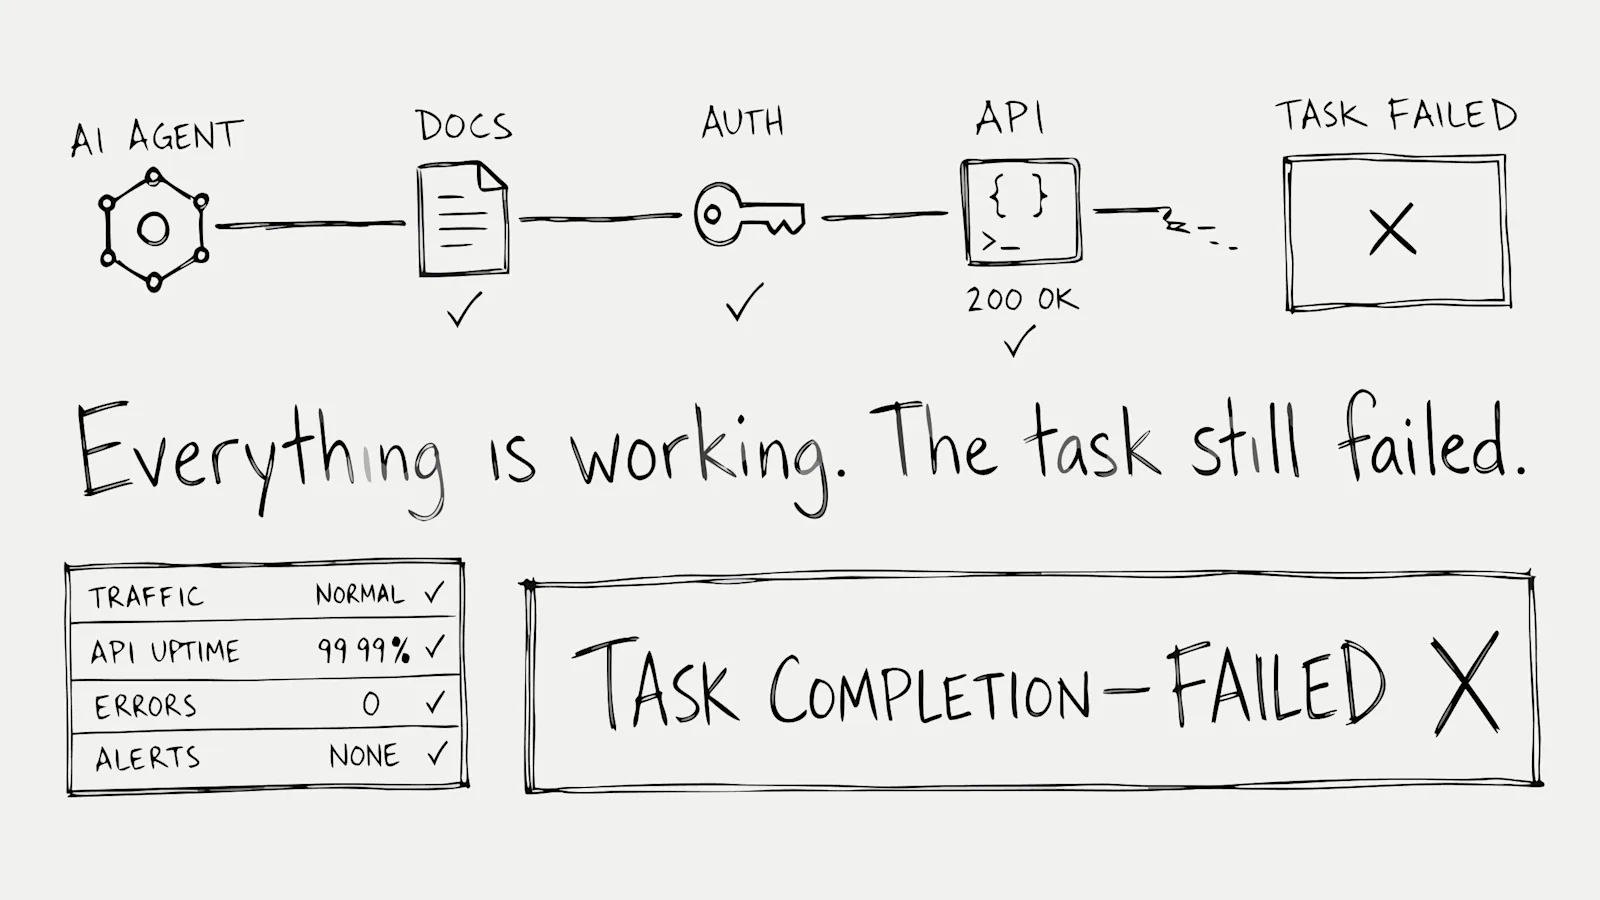
Your product analytics shows normal traffic. Logs look fine. Error monitoring is quiet. An agent still tried to finish a job on your product, could not, and left.
I keep a tab open for the weekly growth snapshot. Last Tuesday it looked like every other Tuesday: sessions flat, API success at 99.4%, error budget green. In Slack, growth posted the PNG with a thumbs-up. Engineering replied that p99 was boring. I only found the missing attempt because I later sorted gateway logs by an unfamiliar prefix and watched a nine-hundred-millisecond sequence die.
The charts were not lying. They were answering a different question than the one that just cost you a buyer. Normal traffic is a description of volume. It is not a description of outcomes.
The failure looks like a successful request
The job was specific: attach your webhook SDK to a checkout so failed payments retry. The agent fetched the quickstart, found the OAuth section, and followed the redirect URI your docs treat as obvious.
Your docs returned 200. The authorize endpoint returned 302, exactly as designed. The agent has no browser to land on. It guessed an Authorization header, called /webhooks, and got 401. It guessed again. Same 401. Then it stopped.
A human would have opened a ticket or pinged Slack. This caller is software acting for a buyer. Agents are a class of user now, and they do not wait for you to notice.
A crash writes a stack trace. This looks like normal traffic that quietly ends. Call that silent failure if you want a name. The important part is the shape: each hop can succeed while the job still dies.
The timestamps from that Tuesday are ordinary. 14:03:11, docs. 14:03:11, authorize. 14:03:12, /webhooks 401. 14:03:12, /webhooks 401 again. No fourth line. If you only tail errors, you will never highlight a sequence that short.
Why nobody gets paged
Your on-call setup is honest about the failures it was built for. A 500 pages someone. A raised exception becomes a ticket. A drop in success rate shows up in the error budget.
None of those fire here.
The docs were healthy. The API rejected a bad credential the way it should. Rate limits never tripped. From the system's point of view, every component did its job. Health checks passed at 14:03 the same as they passed at 14:02.
The task still died. The agent could not complete a multi-step job even though each hop looked legal in isolation. That gap is easy to miss because your tools score hops, not jobs. A hop can be correct and the job can still be over.
You will not see a lost-deal reason in the CRM. The buyer never reached a form. The agent already routed the work to a vendor whose auth path did not require a person in the loop.
What your dashboards actually recorded
Open the three places you already trust.
Product analytics shows a short burst, or nothing, depending on whether JavaScript ran. If a bot filter is on, the burst may have been dropped before the weekly snapshot. The chart still reads normal. The PNG in Slack still gets a thumbs-up.
API logs show two 401s next to thousands of 200s. At 99.4% success, two rejects are weather. Nobody investigates weather. The weekly reliability doc will still say the error budget is comfortable.
Auth logs show a redirect that succeeded. Success, in that log, means the 302 went out. It does not mean the caller got a token and continued. A 302 is a completed hop. It is not a completed login.
If you squint, you can reconstruct the sequence by timestamp and IP. Most weeks, nobody squints. The row looks like scanner noise. The next agent with the same job hits the same wall, and the snapshot looks the same again.
This is why "logs look fine" is a dangerous sentence. Fine means the machinery did not break. It does not mean the visitor finished. Fine is what a silent miss looks like from inside the tool.
The agent already left
Abandonment is fast. The whole attempt can fit inside a second. There is no bounce rate that captures a caller who never rendered a page. There is no exit survey. There is no session replay of a headless client.
You are used to treating quiet dashboards as "nothing happened." For this class of user, quiet often means something happened, then it stopped, and the work went elsewhere. The silence is the leftover, not the proof that the hour was empty.
That choice does not come back later as branded search. The operator who delegated the job sees a working integration. They do not see that your product was in the shortlist for 900 milliseconds.
You can lose a week of comparable attempts this way and still present a clean dashboard on Monday. The failure was silent in the only sense that matters operationally: no alert, no ticket, no owner.
You only notice later, if at all
The first clue is rarely an alert. It is a mismatch you cannot explain. Inbound interest in a category. API keys that never get created. A competitor showing up in a customer's stack after someone asked an assistant to "use the obvious webhook provider."
By then the original request is gone from the hot index. You are guessing.
If you want a metric for whether the job finished, that lives in analytics built for agents, not in a session chart. Stay with the failure scene here. The dashboard stayed green. The user left.
Start with one ugly hour of logs. Pick a docs path that feeds an authenticated endpoint. Line up timestamps. Ask a blunt question: did any of these sequences end in the outcome the docs promise? If the answer is you cannot tell, you are already looking at demand that died without a trace.
You do not need a new category name for that. You need to stop treating a quiet error budget as proof that anything converted.
A useful reconstruction is boring. Same prefix. Docs fetch. Auth redirect. Two 401s. No further calls. That is a lost task, even if every system involved would pass a health check. Write the four lines on a sticky if you have to. Then ask who owns the missing fifth line.
Do this for a single high-value path before you argue about tooling. The argument changes once you can point at a concrete sequence and say the buyer left, and you called it normal traffic. Until you can point at it, the snapshot will keep winning the meeting.
Frequently asked questions
If every request returned 200, how can the task still have failed?
Status codes describe a single hop. A task is a chain: understand the path, obtain access, perform the action, confirm the result. Each hop can return 200 while the chain still fails. A docs page can render. A redirect can fire. A success JSON body can omit the field the next call requires. The agent did not crash. It ran out of a legal next step, and nothing in your stack treats that as an incident.
Why doesn't error monitoring page you when an agent abandons?
Error monitoring watches exceptions, 5xx rates, and the probes you configured. Abandonment is a missing continuation, not a thrown error. The process ends. Nothing violates an SLO. Unless you define "task continued to outcome X" as a signal, the pager stays dark on purpose. Your current alerts were never aimed at a user who leaves without breaking a server.