

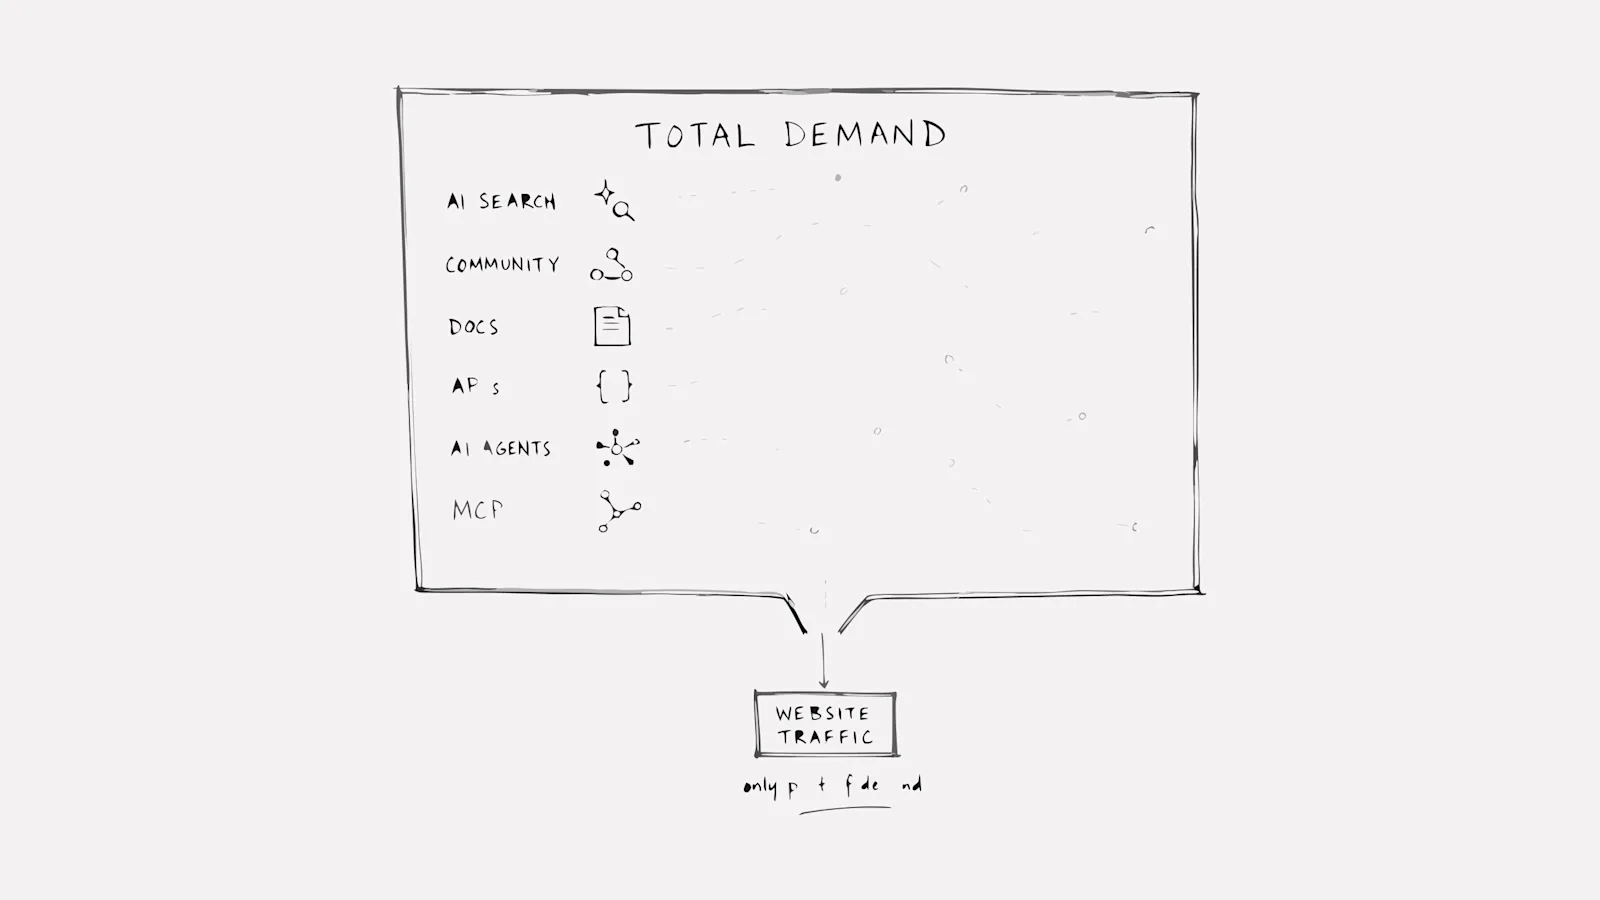
Website traffic used to be a reliable proxy for demand. Sessions went up, interest was up. That relationship no longer holds.
Buyers now research through AI summaries, third-party communities, and software agents that evaluate products without generating traditional sessions. This article explains why traffic metrics miss these shifts, what existing analytics tools fail to capture, and how to measure demand when the visitor is an agent completing a task rather than a human browsing pages.
Why Website Traffic No Longer Maps to Demand
For years, the relationship was simple: more traffic meant more demand. Sessions went up, interest was up. Sessions went down, something was wrong. That relationship has broken.
The connection between user intent and a site visit has been decoupled. Buyers still research products, compare options, and make decisions. But the evaluation increasingly happens before anyone visits your site. Or it happens through software acting on a person's behalf, which looks nothing like a traditional session.
Your analytics dashboard might show sessions declining while actual interest in your product stays flat or grows. The demand exists. The measurement misses it. Developer-tool and API-first companies feel this gap most acutely because agents already interact with their products through docs, APIs, and tools rather than web pages.
What Is Actually Behind the Traffic Decline
Four forces are pulling evaluation activity away from traditional website sessions. Each one breaks the assumption that a visit equals interest.
Zero-Click Search and AI Overviews
Search engines have become answer engines. Google's AI Overviews and tools like ChatGPT now summarize content directly on the results page. A buyer's question gets answered without a click.
Your documentation might be scanned, cited, and used to satisfy a query. The buyer got what they wanted from your content. Your analytics recorded zero traffic. The influence happened; the session did not.
Buyers Researching Without Visiting
Evaluation has moved to third-party surfaces. Buyers read Reddit threads, watch YouTube comparisons, ask in Slack communities, and consult peers before they ever visit a vendor site.
By the time someone lands on your homepage, they may have already decided. The research happened elsewhere. Your funnel only captured the final step, which means traffic looks lower even though interest stayed constant.
Bot and Non-Human Traffic
Crawlers, scrapers, and automated systems now account for a large share of web requests. Depending on how your analytics filters bot traffic, your numbers may be inflated by bots you count or deflated by bots you block.
Either way, the raw session count tells you less about human interest than it used to. The signal is noisier.
Agent Users Acting on Behalf of People
This is the shift that developer-tool companies feel first. AI agents, meaning software systems that execute tasks for humans, now evaluate and use products without traditional browsing behavior.
An agent might read your docs, attempt OAuth, call several API endpoints, and try an MCP tool as part of a single job. That entire journey looks nothing like a human session. Your analytics sees fragments: a short visit, a 401 error, some API calls. The task itself never appears.
How Agent Traffic Distorts Conventional Analytics
When an agent visits your site, the session breaks the assumptions baked into your measurement tools. Sessions are short or fragmented. User-agent strings may be blocked or misclassified. Authentication flows designed for humans fail. Activity appears as noise rather than signal.
Here is what typically happens:
- What analytics sees: Bot traffic, 401 errors, partial sessions, disconnected API calls
- What actually happened: An agent attempted to complete a task on behalf of a user
The gap between the recorded data and the actual event is where demand disappears. An agent may have evaluated your product, hit a barrier, and moved on to a competitor. Your analytics recorded nothing useful about that decision. No demo request. No sales email. No lost-deal reason in your CRM. The opportunity ended before your funnel started.
What Existing Analytics Tools Record and What They Miss
Product analytics and observability tools each capture part of the picture. Neither reconstructs the task.
Tool Type | What It Records | What It Misses |
|---|---|---|
Product analytics | Pageviews, sessions, clicks, funnels | Task intent, agent identity, cross-surface activity |
Observability | API calls, latency, error rates | Why the call was made, whether the task succeeded |
What Product Analytics Captures
Product analytics tracks pageviews, session duration, and conversion funnels. The tools assume a human user moving through a web interface, clicking buttons, filling forms, following a path. That model works for human visitors. It breaks when the actor is an agent.
What Observability Captures
Observability tools record API request logs, error codes, and latency. They tell you whether your infrastructure is healthy and which endpoints are being called. They do not tell you why the call was made or whether the caller accomplished what they came to do.
What Neither Reconstructs
Neither tool type connects the dots. An agent might read your docs (one pageview), hit OAuth (one auth log entry), call your API (one observability event), and try an MCP tool (one tool call). Each system records its fragment. No system reconstructs the task.
Did the agent succeed? Did it abandon? Did it switch to a competitor? Without task-level reconstruction, you cannot answer these questions.
The Agent Journey Across Docs, Auth, APIs, and MCP
Picture an agent trying to integrate your API into a customer workflow. The journey crosses multiple surfaces, and each surface lives in a different system:
- Agent reads docs (web analytics records one pageview)
- Agent hits OAuth (auth logs record a 401 or token issued)
- Agent calls API (observability records an API request)
- Agent tries MCP tool (MCP logs record a tool call)
- Agent completes or abandons (no record in any system)
MCP, or Model Context Protocol, is a standard that lets AI agents interact with external tools and services. If you expose MCP tools, agents can call them directly. That activity lives in yet another system, disconnected from your web analytics and API logs.
The agent's task spanned all of these surfaces. Your measurement recorded each fragment in isolation. The task itself, and its outcome, remained invisible.
Why Pageviews Are the Wrong Unit of Progress for Agent Users
Agents do not browse. They read, evaluate, and act.
A single pageview may represent a complete evaluation. Multiple API calls may represent one task. The relationship between pages visited and progress made does not hold for agent users the way it does for humans.
Pageviews measure presence. For agent users, the unit of progress is the completed task. Did the agent finish what it came to do? That question cannot be answered by counting sessions.
How to Measure Demand With Agent Task Completion Rate
The metric that reflects actual agent demand is Agent Task Completion Rate: completed agent tasks divided by agent tasks started.
Calculating this rate requires reconstructing the task from fragmented signals across surfaces. You connect the doc visit to the auth attempt to the API call to the MCP tool usage. Then you determine whether the task succeeded or failed.
This is the measurement gap GrowthOS is built to close. We identify agent activity, stitch behavior across public websites, documentation, APIs, and MCP, reconstruct the intended task, and show whether the agent completed it. The north-star metric is whether the agent finished the job it started.
Get the Agent Traffic Blindspot Report to see where agent demand disappears inside your analytics: usegrowthos.com.
How to Adjust Your Measurement Strategy Now
You can start adapting your measurement approach today, even before adopting new tooling.
1. Stop Reading Traffic Decline as a Failure Signal
Traffic decline may mean demand shifted to agent-driven or off-site evaluation. Before concluding that interest dropped, check other signals: API call volume, documentation engagement patterns, conversion rates among visitors who do arrive.
A drop in sessions paired with stable or rising conversions suggests the traffic you lost was low-intent. The high-intent activity may still be happening, just not in a way your analytics captures.
2. Segment Agent Traffic From Human Sessions
Identify agent activity using user-agent strings, request patterns, and session characteristics. Look for short sessions, high API call volume with no corresponding pageviews, and authentication failures that do not match human patterns.
Once segmented, you can analyze agent behavior separately from human behavior. The two groups have different journeys and different success criteria.
3. Reconstruct the Task Behind Each Agent Session
Connect activity across docs, auth, API, and MCP to understand what the agent was trying to do. This requires correlating events across systems, which is difficult with current tooling but possible with careful log analysis.
Even partial reconstruction reveals patterns: which docs agents read most, where auth fails, which API endpoints get called together.
4. Track Outcomes at the API and MCP Layer
Measure task success at the endpoint level, not the page level. API completion and MCP tool success are better signals than pageviews for understanding agent demand.
If an agent calls your API and gets a successful response, that is a completed interaction. If it calls and gets a 401, that is a barrier. These outcomes matter more than how many pages the agent visited.
Where Agent Demand Measurement Goes From Here
Agents are moving from "look something up" to "do the work." Developer tools feel that shift first because agents already operate through docs and APIs. As agents start comparing vendors, kicking off purchases, and running multi-step workflows without a human in the loop, the same blind spot shows up everywhere else.
Teams that learn to measure agent task completion early will own a channel others still dismiss as noise. Teams that wait will keep optimizing human funnels while agent-driven demand quietly fails elsewhere.
Pageviews were never the unit of progress for agent users. The completed task is.
See where agent demand disappears in your analytics. Get the Agent Traffic Blindspot Report at usegrowthos.com
Frequently Asked Questions About Measuring Demand Beyond Website Traffic
Is website traffic still a useful metric for measuring demand?
Yes, for human visitors. Traffic remains relevant for traditional funnel analysis. However, for API-first and developer-tool companies, traffic alone misses agent-driven evaluation. Pairing session metrics with task-level measurement gives a more complete picture.
How can I tell if AI agents are visiting my website or API?
Look for short sessions, unusual user-agent strings, high API call volume with no corresponding pageviews, and authentication failures that do not match human patterns. Agents often read docs quickly, attempt programmatic auth, and make multiple API calls in rapid succession.
Can Google Analytics measure agent activity or MCP tool usage?
No. Google Analytics tracks browser-based sessions. It does not connect API calls, MCP tool usage, or auth flows into a unified task view. Reconstructing agent journeys requires correlating data across multiple systems.
What metric replaces sessions and pageviews for API-first companies?
Agent Task Completion Rate measures completed tasks divided by started tasks. This captures whether agents successfully use your product, not just whether they visited. It is the metric that reflects actual agent demand.